|
Scope: Explore for all tickers
where the volume has been above twice the average volume for the
past 3 bars.
|
|
|
|
| Step 1
- Start AmiBroker and
PowerScan.
Note: If you have not yet installed either of these programs click
on the link to the download page and follow the installation
instructions.
|
|
|
|
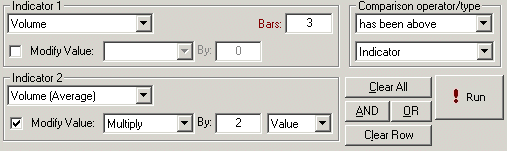
| Step 2
- Setting exploration parameters.
Enter the following exploration parameters into PowerScan as
per the example.
|
| |
Example:
 |
|
|
|
| Step 3
- Setting indicator preferences.
We need to set the Volume average preference from within PowerScan to
match those in this tutorial.
|
| |
i) Select: Tools-->Preferences
ii) Locate the Volume
average preference setting and
ensure that the value is set to 15 periods:
|
Example:
 |
|
|
|
| Step 4
- Enter your exploration criteria.
Enter the following criteria and click the !Run
button . This will launch the Amibroker automatic analysis
window (AA) and perform the exploration within AmiBroker.
|
| |
Common
Expression: The Volume has been above
the Volume (Average)*2 for the previous 3 bars. |
Example:
 |
|
|
|
| Step 5
- Viewing exploration results within AmiBroker.
Note that there were a total of 13 tickers (see bottom
status bar of results pane) that met the exploration criteria. To view the
chart for each ticker you can double click the ticker in the
results list from within the Automatic Analysis (AA) window.
|
| |

|
|
|
|
| Step 6
- Inserting the built-in Volume and Volume Average indicator.
Positioned in the graphic below are two chart panes each
containing various indicators. You are more than likely
already familiar with the general price chart pane (the top
one of the two) so we will go on and add the built-in Volume indicator to the chart.
Note: Be sure that the AmiBroker
built-in Average Volume indiacator is also set to 15 periods
via the following AmiBroker menu items:
Tools-->Preferences-->Indicators
|
| |
i) Close the AA window if you have not already done so.
ii) Right mouse click (RMC) anywhere in the main price chart area
and select the following item from the floating menu: Insert -->
Volume
It should appear as below. You should be able to see where the
last 3 volume spikes are more than twice the 15 period average
(Red line)
|

|
|
Additional Information
Clicking this link will provide you with some addition information
about the Volume
indicator.
Finished
|