| Step 1
                  - Set the following exploration parameters from the PowerScan interface. | 
               
              
                | Apply
                  To: | 
                all
                  tickers | 
               
              
                | 
                  Range:  | 
                
                  n last bars | 
               
              
                | n=: | 
                1  | 
               
              
                | 
                  Analysis type: | 
                Explore | 
               
             
           | 
        
        
          | 
           | 


                | Step 2
                  - Set the moving average preferences from within PowerScan to
                  match those in this tutorial. | 
               
              
                |   | 
                Select: Tools-->Preferences 
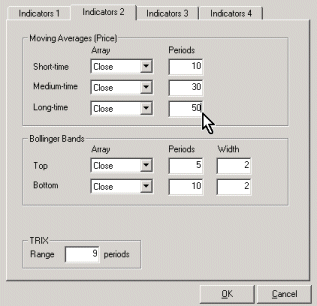
                  Locate the Moving Averages (Prices) preference setting and
                  ensure that the following values are set:
                  Medium time: Close 30 
                  Long time: Close 50  | 
               
              
                  | 
               
             
           | 
        
        
          | 
           | 


                | Step 3
                  - Enter the following criteria and click the !Run
                  button . This will launch the Amibroker automatic analysis
                  window (AA) and perform the exploration. | 
               
              
                |   | 
                The Simple MA (Medium)
                  crosses above the Simple MA (Long) on the current bar | 
               
              
                  | 
               
             
           | 
        
        
          | 
           | 


                Step 4
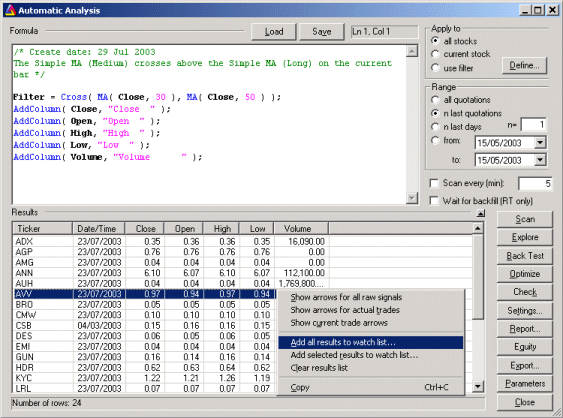
                  - From within the AA window right mouse click (RMC) any of the
                  results and select: "Add all results to watch list."
                  from the floating menu.  
                   
                  Note: You could view the
                  charts for each of these tickers that passed the criteria
                  right from the AA window by double clicking the mouse (DMC)
                  on each of the ticker symbols but I find the following method
                  more convenient because it gives you a clear view of the chart
                  area without having to close the AA window each time.  | 
               
              
                |   | 
                  | 
               
             
           | 
        
        
          | 
           | 


                Step 5
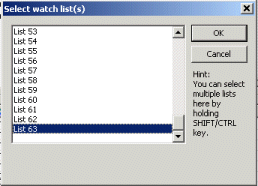
                  - Select a watchlist from the list.  
                  (Suggestion: I usually reserve
                  List 63 for this and empty the list after I've finished in
                  preparation for the next exploration.) 
                   
                  Tip 
                  You can rename the watchlist in AmiBroker to something more
                  meaningful via the following menus: 
                  Symbol-->Categories...-->Watch list   
                  Select the generic name and click the Edit button to make the
                  change. | 
               
              
                |   | 
                 
                    
                 | 
               
             
           | 


                Step 6
                  - To view the AmiBroker Workspace select the following menu
                  items: View -->Workspace 
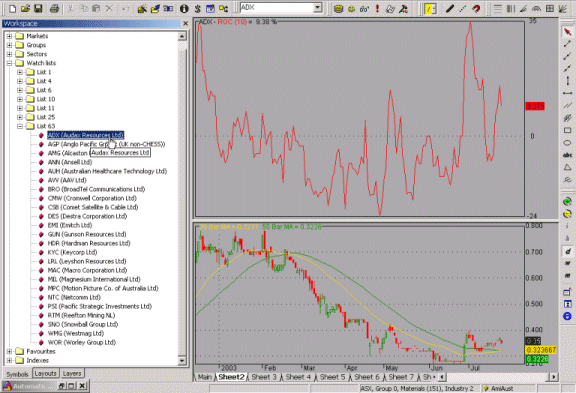
                  Navigate to the Watch list folder and locate List 63 where you
                  will find all the tickers from the exploration results. To view the
                  chart for these tickers is a simple matter of selecting each
                  one with the mouse or using the up and down arrow keys on your
                  keyboard. 
                  
                  Tip: To empty the list RMC
                  on List 63 and select "Erase (Make Empty)" then
                  click OK. 
                 | 
               
              
                |   | 
                 
                    
                 | 
               
             
           | 
        
        
          | 
           | 


                Step 7
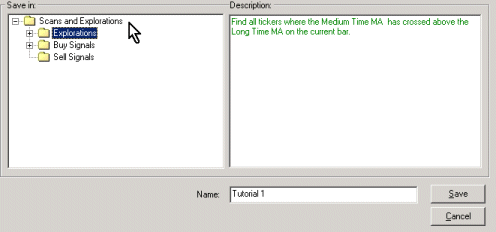
                  - Saving your formula in PowerScan. 
                   
                  Maximise the PowerScan tool and select File-->Save As. 
                  Select the Exploration folder. 
                  Type in a name for the formula (I called it Tutorial 1). 
                  Enter a description for your formula. 
                  Click the 'Save' button. | 
               
              
                |   | 
                 
                    
                 | 
               
             
           | 
        
        
          | 
           | 
        
        
          | 
           | 
        
        
          | 
           | 
        
        
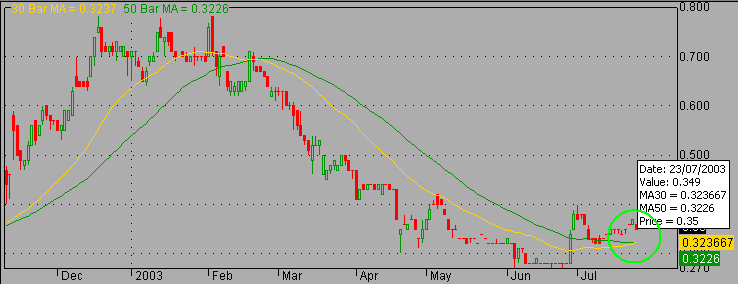
          Sample result
            chart - This is a sample chart from
            one of the tickers that passed the exploration criteria. It shows the gold
            line (30 bar MA) crossing up above the green line (50 bar MA) on the
            current bar (dated 23/07/2003) 
             
             
           | 


                Indicator
                  Formula - You can use the following formula to create a
                  custom indicator using AmiBroker Indicator Builder. This will
                  allow you to view the moving averages as per the above chart. 
                  Once you paste this into the Indicator builder ensure you set
                  the following settings before saveing your indicator.
                   
                  Scaling: Automatic 
                  Grid lines (Ticked): Limits |
                  Show Dates | Middle | 
               
              
                 | 
                MAC30 = MA(C,30); 
                  MAC50 = MA(C,50); 
                  Title = EncodeColor( colorGold)
                  + "30 Bar MA =" + WriteVal(
                  MAC30, 7.4 ) + 
                  " " + EncodeColor(
                  colorGreen) + "50 Bar MA
                  =" + WriteVal( MAC50,
                  7.4 ); 
                  Plot( MAC30, "MA30",
                  colorGold, styleLine ); 
                  Plot( MAC50, "MA50",
                  colorGreen, styleLine ); 
                  Plot( Close, "Price",
                  colorBlack, styleCandle );
                     | 
                 | 


               |